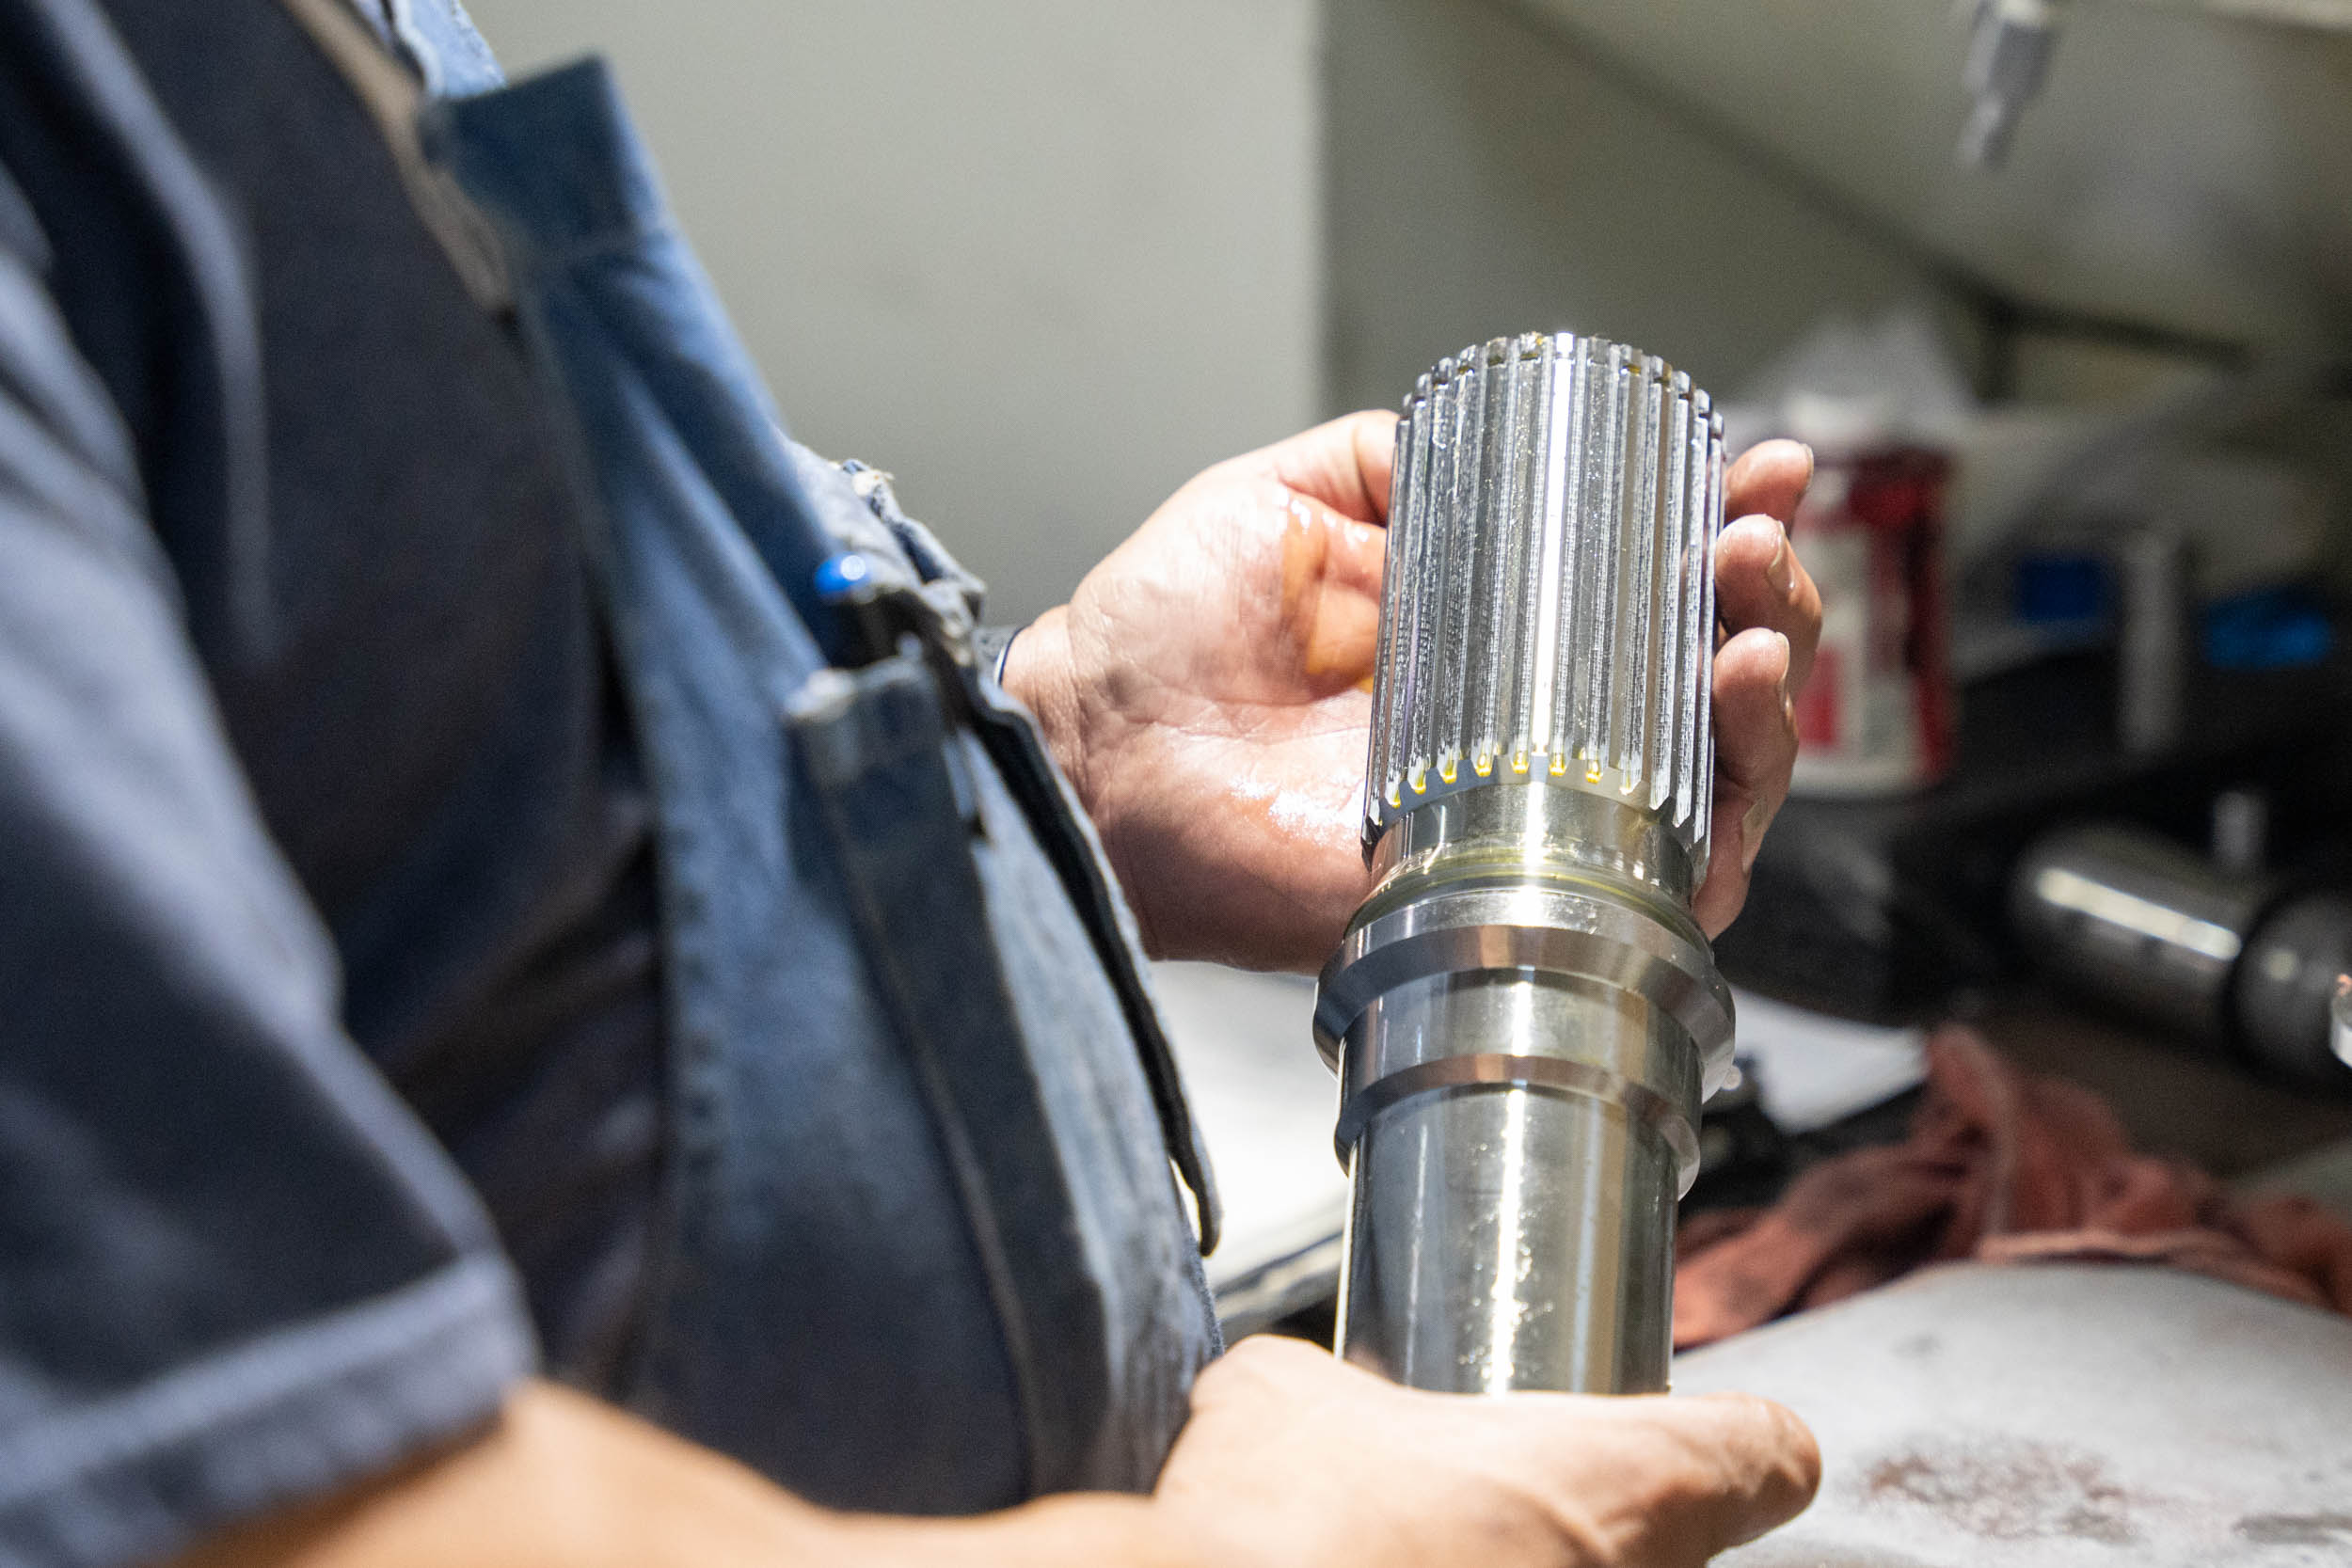
How to Read a Gear Inspection Chart


The patterns on an inspection chart point back to the gear-making process. Here's how to read them.
Interpreted well, a gear inspection chart can flag a tool or setup problem on the first part instead of after a run of rejected ones. It shows how each tooth left the machine, and the shape of an error can point to where it started. A profile that leans near the tip, for instance, often comes back to the hob's sharpening. Knowing what each measurement shows also helps you choose a quality class that fits the gear, without specifying tighter tolerance than it needs. This Gear School guide covers how to read each of the four core measurements against its tolerance, along with what the quality class on your report means.
Every chart compares a measured tooth to its design. The size of an error decides pass or fail, and its shape points to the cause.
Why are gears inspected differently than other parts?
A gear's function depends on geometry that repeats across every tooth.
On a shaft or housing, inspection mostly goes feature by feature, a diameter here, a bore there. A gear's performance depends on each flank's shape, how it lines up across the face, where each tooth sits around the gear, and how well the tooth set centers on its axis. Because these are continuous surfaces and relationships, the measuring machine records them as charts, and you read them as patterns.

Each chart shows the gear as the machine left it, so it also records the process. The blank, fixture, machine setup, cutting tool, heat treat, and machine condition all show up on it. For example, a helix trace that swings from plus to minus from tooth to tooth usually comes from the blank, the fixture, or the machine rather than the tool.
What are the four measurements on a gear inspection chart?
Most parallel axis gear inspection reports cover profile, helix, pitch, and runout. Each checks a different part of the gear geometry and reflects how the gear runs.

Profile
Profile is the shape of the tooth flank from root to tip, which on most parallel axis gears is an involute. The probe traces the flank, typically at mid-face, and the measuring machine compares it to the design profile. What matters most is the active profile, the part of the flank that makes contact in mesh, from just above the root fillet to the tip.
Profile error disrupts how teeth roll through the mesh, which shows up as noise, uneven loading, and in extreme cases, early failure.
Helix
Helix, previously called lead, is the tooth trace across the face width, compared to the design helix. The probe follows it at the pitch diameter, from one end of the face to the other.
Helix controls how load spreads across the face. When it's off, load concentrates on part of the tooth, which adds noise and wear.
Pitch
Pitch measures where each tooth sits compared to its theoretical position, and most reports show it two ways. Single pitch, also called tooth-to-tooth, is the spacing error between neighboring teeth. Cumulative pitch adds those errors up over the full revolution, so small single pitch errors can still build into a large cumulative one.
Spacing error is a major source of gear noise because it disrupts the load handoff from one tooth to the next.
Runout
Runout shows how far the tooth set sits off-center from the datum axis, usually the bore or the journals. A CNC gear measuring machine (GMM) checks it automatically, tooth by tooth.
Excess runout changes backlash as the gear turns, adding a once-per-revolution variation in motion. Under ISO 1328, runout isn't mandatory unless the manufacturer and purchaser agree to it, so some reports won't include it.
Chart Reading Defined
Four terms worth knowing before your next inspection report.
Trace
The line the measuring machine records as the probe follows the tooth, plotted against the design.
Total deviation
The spread of the trace over the evaluation range, measured between two lines that follow the design shape. Reports compare it to an allowable value for the quality class.
Quality class
A number that sets the allowable tolerance for each measurement. Its meaning depends on the standard.
Composite inspection
A functional check that rolls the gear against a master gear and records the change in center distance.
How do you read a gear inspection chart?
Start with orientation, then read the trace against its allowable deviation. Layouts vary by GMM, but nearly every chart shows the same elements.

Find root, tip, and direction.
Look for where the chart marks root and tip for profile, or the ends of the face for helix, and which direction is plus. Charts run vertically or horizontally depending on the GMM. Plus means extra material at that point on the tooth, and minus means material is missing.
Read the Trace
An unmodified tooth with no error plots as a straight line. Where the trace leaves that line shows where the error sits on the tooth. A trace that leans across the whole flank has a different cause than one that only hooks near the tip, for example.
Check the total deviation.
The report measures total deviation, the spread between two lines that follow the design shape and just enclose the trace over the evaluation range. For profile, that's total profile deviation (Fα). The report prints it beside the allowable value for the specified quality class, so you can see the margin at a glance. Older K-charts drew a tolerance zone around the trace. Current standards compare total deviation to the allowable value instead.
Note the evaluation range.
The chart grades only part of the trace. For profile, the evaluation range starts at the profile control diameter and, unless the print specifies otherwise, covers 95% of the distance from there to the tip form diameter. A deviation right at the root or the very tip can fall outside the graded range.
Check the Magnification
Charts can magnify deviation heavily, so a few microns can look dramatic on paper. Check the scale before judging how large an error is.
What does a good chart look like?
Every trace stays within its allowable deviation across the evaluation range, and the traces look alike across the measured teeth with no repeating pattern. Most reports check profile and helix on several evenly spaced teeth, on both flanks, so how well those traces agree matters as much as any single one.
Some curved traces are intentional.
Many gears carry deliberate modifications, most commonly profile crown and helix crown. A helix-crowned tooth bows across the face by design to ease load at the ends of the tooth, so its trace bows too. The design curve becomes the reference, and the chart measures deviation from it.

What do common chart patterns look like?
Here's one example per measurement and what each pattern tells you.
Profile Tip Error

In the positive tip condition, the trace leans toward plus near the tip, so the tooth carries extra material there. The negative tip condition leans the other way, with extra material toward the root.
On a hobbed gear, both usually come from one of two sources. The first is hob sharpening. If sharpening leaves the rake angle on the hob's cutting face off, the hob tooth's effective pressure angle changes, and the gear's profile changes with it. Positive rake error puts extra material at the tip, and negative rake error does the reverse. The second is the hob head swivel angle. If the swivel angle is off, or the error returns after resharpening, check the hob head alignment and scales.

Start by checking the hob's rake angle against its quality class, and review the sharpening process if it's off. Then confirm the hob head swivel angle.
Helix Wobble

This chart shows helix on both flanks of four teeth, about 90° apart. From one tooth to the next, the helix trace swings from plus to minus and back, the pattern known as wobble. The tooth set sits tilted relative to its measuring axis.
Wobble usually comes from one of four places.
- The part blank. Faces that aren't parallel, or a bore that isn't perpendicular to them.
- The fixture. Misalignment or runout on the fixture face.
- The machine. A misaligned tailstock, a worn or damaged tailstock center, or runout in the work spindle.
- The inspection setup. Runout in the inspection arbor or fixture, or a misaligned tailstock on the measuring machine.
The chart records what the probe sees, so a misaligned inspection setup can make a good gear look bad.
Pitch

Single pitch typically plots as a bar for each tooth, scattered around zero, with the cumulative curve running across all the teeth. A cumulative curve that rises and falls once per revolution often indicates runout, since an off-center tooth set shifts each tooth's position in a once-around pattern. A basic runout check won't always catch that, which is one reason reports measure pitch on its own.
Runout

The chart plots the radial position of each tooth space in turn. On this 96-tooth gear, one side reads high, and the opposite side reads low. The spread between the highest and lowest readings, 0.0011 in, is the runout value.


What does a quality class tell you?
A quality class is a single number that sets the allowable tolerance for every measurement on the chart. That number only means something once you know which standard it comes from.
Two standards, opposite directions.
The current standard is ISO 1328-1:2013, published in the U.S. as ANSI/AGMA ISO 1328-1-B14. It has 11 flank tolerance classes, numbered 1 through 11; lower numbers mean tighter tolerances. Each class step changes the tolerance by a factor of the square root of 2, about 1.4, so tightening two classes roughly halves the allowable error.
Most prints and shop conversations still use the legacy standard, ANSI/AGMA 2000-A88. Its classes run Q3 through Q15, and higher numbers mean tighter tolerances. ANSI/AGMA 2015-1-A01 replaced it in the early 2000s, and ISO 1328-1 has since replaced that.

That's why a callout like "AGMA 10" is ambiguous on its own. Under the legacy standard, it describes a respectable mid-range gear. Under ISO 1328-1, class 10 sits near the loose end of the scale. The two systems also calculate tolerances differently, so no clean conversion exists between them. Name the standard alongside the class every time.
Prints from European or Japanese customers may also carry DIN or JIS classes. The same rule applies, so check the standard before reading anything into the number.
What quality class can each process reach?
Achievable quality depends on the machine, tooling, setup, and part, so treat these as typical values. The following chart uses legacy AGMA classes, since most prints use them.
Process Capability Chart
Typical achievable class, legacy AGMA. Higher is tighter.
- Hobbing Q12
- Shaping Q12
- Power skiving Q12
- Grinding Q15
For example, American Precision Gear holds Q12 and higher on its MZ 1000 D-Drive hobbing machine.
Which measurements matter most for your application?
Some applications depend far more on certain measurements than others. Tightening the class only where it affects performance keeps cost in line with what the gear needs.
Application Sensitivity Chart
| Profile | Helix | Pitch | Runout | Tooth thickness | |
|---|---|---|---|---|---|
| High-speed or low-noise drivesTransmission error shows up as noise | Yes | Yes | Yes | No | No |
| Positioning systemsWhere the output stops is what counts | No | No | Yes | Yes | Yes |
| Heavily loaded gearsLoad has to spread across the face | No | Yes | No | No | No |
When is composite inspection enough?
It depends on the gear's diametral pitch and the quality requirements in the specified standard. Each inspection method sees something different.
Composite inspection, also called double flank or functional inspection, rolls the work gear in tight mesh against a master gear. A spring holds the master against the work gear with no backlash, and the instrument records how center distance changes as they turn. That produces a tooth-to-tooth reading and a total composite reading. It's a fast shop-floor check of size, runout, rolling action, and nicks, but it can't isolate individual flank errors.

Analytical inspection measures each element separately. A GMM traces profile and helix, indexes for pitch, and checks runout, producing the charts covered in this guide. It takes longer, and it shows which element is off and by how much.
Single flank inspection rolls the gear against a master at its design center distance, with backlash, and measures variation in rotary motion. Because that's close to how the gear runs in service, it shows how well the profiles work together in mesh. It doesn't replace analytical helix inspection.

What doesn't an inspection chart tell you?
A passing chart confirms the geometry. Some factors that affect how a gear performs never show up on it.
Inspection Coverage Chart
| The chart tells you | It doesn’t tell you | Check it with |
|---|---|---|
| Geometry along each measured line | Burrs or chips away from the measured line | A composite roll check |
| Profile, helix, pitch, and runout deviation | Surface finish | A separate roughness measurement |
| Whether the geometry meets its quality class | Hardness, case depth, or grinding damage | Heat treat and material checks |
| Accuracy, one input to a load rating | Load capacity | Load rating standards |
| Whether the gear matches its print | Whether the design suits the job | A design review against the application |
| How the gear left the machine | How it runs once assembled | Housing alignment and bearing checks |
| The symptom, as a pattern on the chart | The root cause | Troubleshooting the process with our applications engineers, from the tool and fixture to the setup and machine |
Where Helios fits in.

Once a pattern shows up on a chart, the next question is what to change. Our applications engineers work through inspection results with you to find each pattern's source, whether it's the tool, fixture, setup, or machine.
When the tool is the source, our cutting tool service reconditions it, stripping, resharpening, and recoating the tool in one bundled process, so it returns to service with the geometry its design calls for.
When the machine is the source, our machine service team can help. For legacy Koepfer machines, the Repowered program rebuilds and re-controls the machine with a modern CNC package, new servo and spindle motors, and updated electrical documentation, at a fraction of the cost of new. If the machine caused the quality issue, a rebuild can resolve it.
Gear inspection charts at a glance.
The four core measurements and what to look for in each.
-
Profile
Tooth flank shape, root to tip
Good looks like traces within allowable deviation, consistent across the measured teeth.
MeasuredSeveral teeth, both flanksWatch forLeaning or hooked trace near tip or root -
Helix
Tooth trace across the face
Good looks like traces within allowable deviation, consistent across the measured teeth.
MeasuredSeveral teeth, both flanksWatch forPlus-to-minus swing around the gear -
Pitch
Tooth spacing around the gear
Good looks like small, scattered single pitch and a flat cumulative curve.
MeasuredEvery toothWatch forOnce-around rise and fall in cumulative pitch -
Runout
Tooth set centering on the axis
Good looks like a small, smooth spread.
MeasuredEvery toothWatch forOne clear high and low point
-
Straight line?
An unmodified tooth with no error. A crowned tooth should follow its design curve instead.
-
Class number?
Check the standard. Legacy AGMA runs higher-is-tighter, and ISO 1328 runs lower-is-tighter.
-
No runout on the report?
Under ISO 1328, it’s only required when the manufacturer and purchaser agree to it.
Not sure what your chart is telling you? Talk with our applications engineers.
FAQ
What does the quality class on my inspection report mean?
It sets the allowable tolerance for each measurement. Under legacy AGMA, a higher number is tighter. Under ISO 1328-1, a lower number is tighter, so check which standard the report uses.
What does AGMA Q12 mean?
Q12 is a legacy AGMA 2000 class. Higher numbers are tighter on that scale, so Q12 indicates a high-quality gear, typical of what hobbing and shaping can reach.
Is a curved trace always a bad sign?
No. Gears with profile crown or helix crown should show a curved trace, and the chart judges it against the design curve.
Why do the left and right flanks look different on my chart?
The machine cuts and measures each flank as its own surface, so the traces don't have to match. Where they differ is often an early clue to the cause of an error.
Why doesn't my report include runout?
Under ISO 1328, runout measurement isn't mandatory unless the manufacturer and purchaser agree to it. If you need it, specify it.
When is composite inspection enough?
It depends on the gear's diametral pitch and the quality requirements in the specified standard. Composite checking is fast and catches size, runout, rolling action, and nicks, but it can't isolate errors on individual flanks. Our applications engineers can help you decide what your parts need.
Can a gear pass inspection and still have problems?
Yes. Inspection confirms geometry. Surface finish, heat treatment, load capacity, and how the gear runs once assembled each need their own checks.